Mta Subway Analysis And Pandas
The first project at Metis involved analyzing the NYC Metropolitan Transportation Authority (MTA) turnstile data in order to provide recommendations to a womens’ tech organization as to which subway stations they should target in order to advertise for their annual gala.
The MTA data is pretty impressive - you can view the number of riders entering and exiting each station (even down to each turnstile!) within every four hour window. That is, after you’ve cleaned all of the data, of course, and gotten it in a form that you can work with.
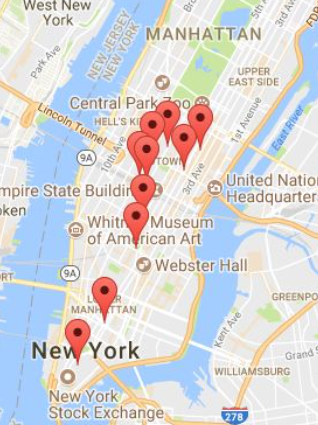
In my group, we broke up work according to what time of day we were interested in stationing advertisers. Since I was assigned weekday morning commutes, I found the top 10 busiest station exits between 8 am and 12 pm (since the data was given in four hour intervals). The busiest stations were:
- 34 ST-HERALD SQ
- 47-50 STS ROCK
- GRD CENTRL-42 ST
- TIMES SQ-42 ST
- 34 ST-PENN STATION
- 23 ST
- LEXINGTON AVE/53
- 14 ST-UNION SQ
- CANAL ST
- FULTON ST

I was interested in placing advertisers in stations that were business districts, rather than touristy areas, in order to maximize the likelihood of reaching local tech workers. To that end, I examined which destination stations had the largest difference between weekday and weekend morning activity. I surmised that these stations were likely business districts. This was a good guess, as immediately, the tourist heavy stations of Penn Station, Canal Street, and 14th-Union Station were no longer in the top 10, and were replaced with Wall St, Chambers St, and Bryant Park in business districts. The top ten stations with greatest difference between weekday and weekend morning volume were:
- 47-50 STS ROCK:w
- GRD CENTRL-42 ST
- 34 ST-HERALD SQ
- LEXINGTON AV/53
- TIMES SQ-42 ST
- 23 ST
- 42 ST-BRYANT PK
- WALL ST
- FULTON ST
- CHAMBERS ST
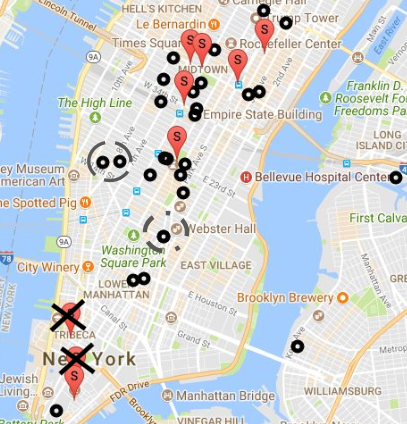
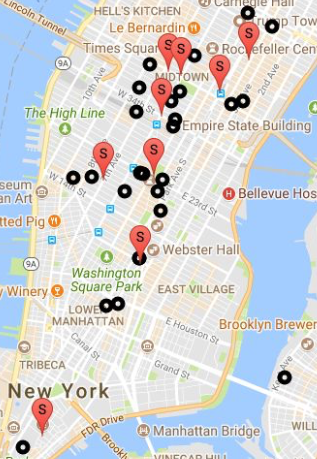
Not surprisingly, though, three of the top ten highest volume destinations on weekday mornings were in the financial district, which is not where many tech companies are located. I used the Google Maps API to superimpose the largest tech employers depicted with black circles (according to Built in NYC) with these ten station recommendations, and found that there were no subway recommendations currently near Twitter, Google, or Facebook (circled in gray). Thus, I suggested moving two of the advertisers from the financial district to the Astor Place and 18th St stations in order to be closer to the Twitter/Google and Facebook locations:

Thus, my final top ten recommendations as to where to station advertisers on weekday mornings were:
- 47-50 STS ROCK
- GRD CENTRAL-42 ST
- 34 ST-HERALD SQ
- 23 ST
- ASTOR PLACE
- 18TH ST
- LEXINGTON AVE/53
- TIMES SQ-42 ST
- 42 ST-BRYANT PK
- WALL ST

In summary, this project provided a great opportunity to get my hands on a real data set and be forced to analyze it well enough in order to provide valuable recommendations under a tight deadline. You can find my GitHub repo here. I can’t wait for Week 2!