
Fantasy Football And Regression
Our second project at Metis involved using scikit-learn and regression models in order to analyze a data set of our choosing. I chose to analyze fantasy football performance, of course, as I wanted to improve my chances of slaughtering my fantasy opponents this season. Each pre-season, ESPN puts out projected rankings of how each player will perform. In September of 2016, ESPN released the top 300 player rankings. You can view the top 10 projected players according to ESPN and the top 10 actual fantasy leaders for the 2016 season below:
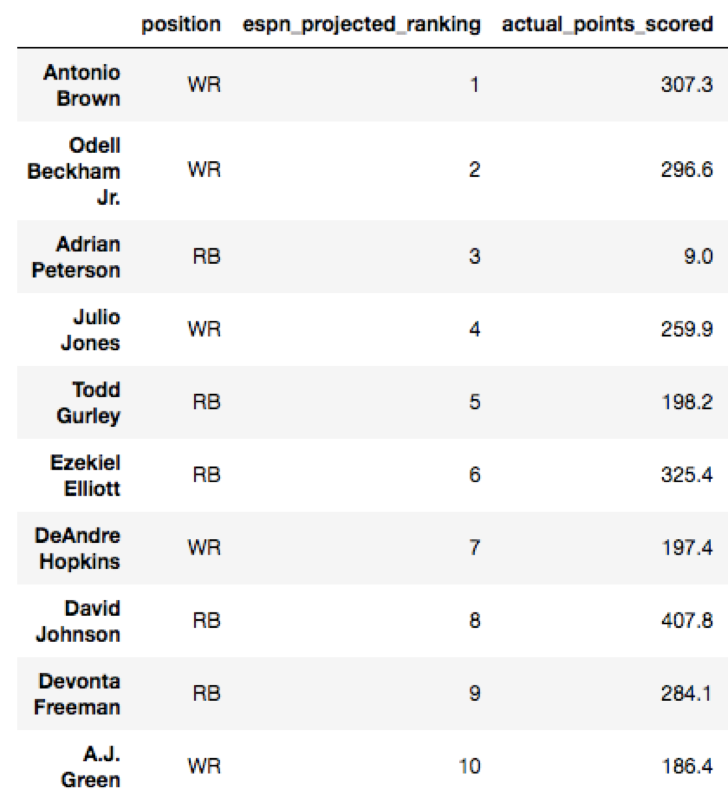
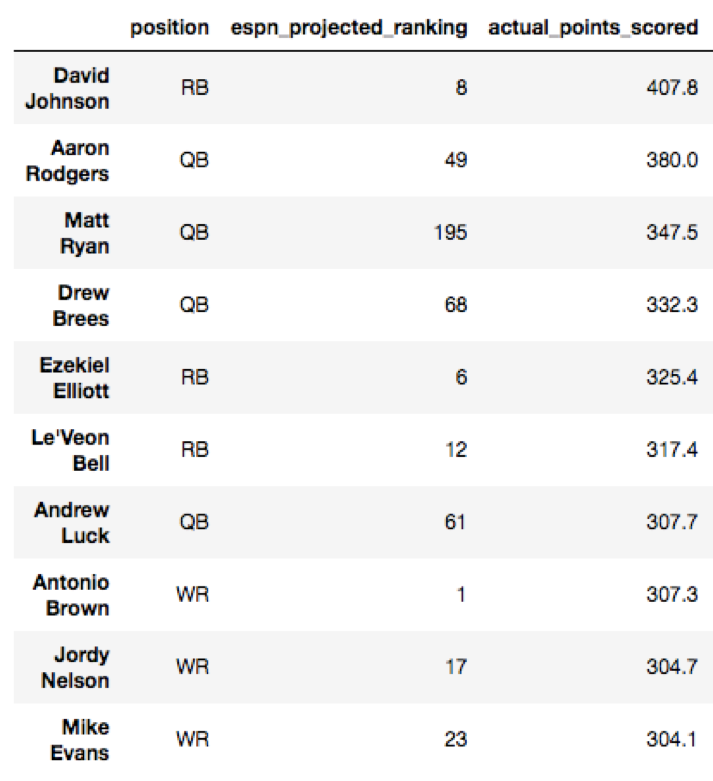
As we can see, ESPN erroneously predicted Adrian Peterson to be the third highest fantasy scorer, and totally underestimated how well quarterbacks like Aaron Rodgers and Matt Ryan would do. Who were the most under and overestimated players using ESPN’s rankings? Let’s view those below by sorting the residuals:
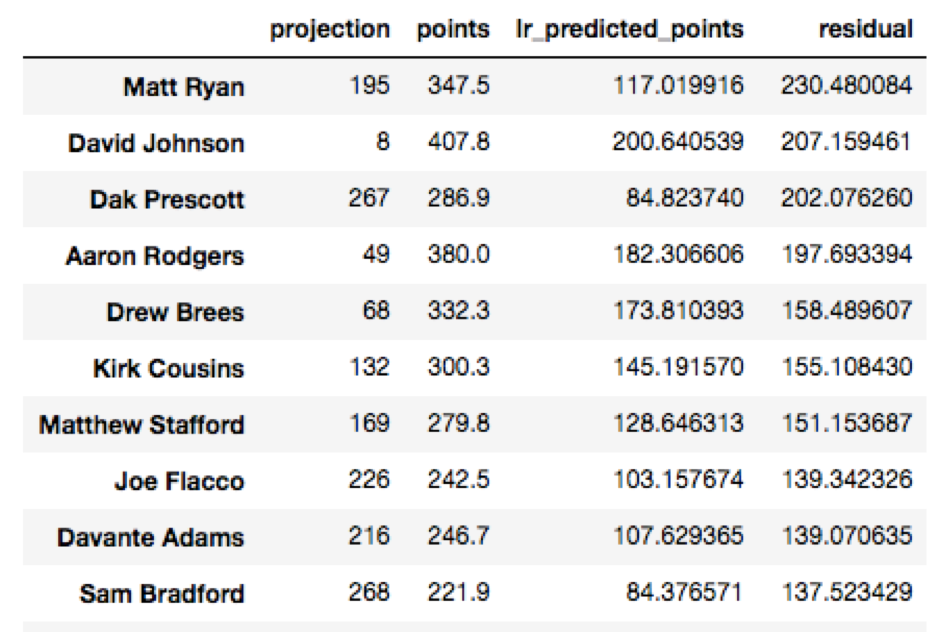
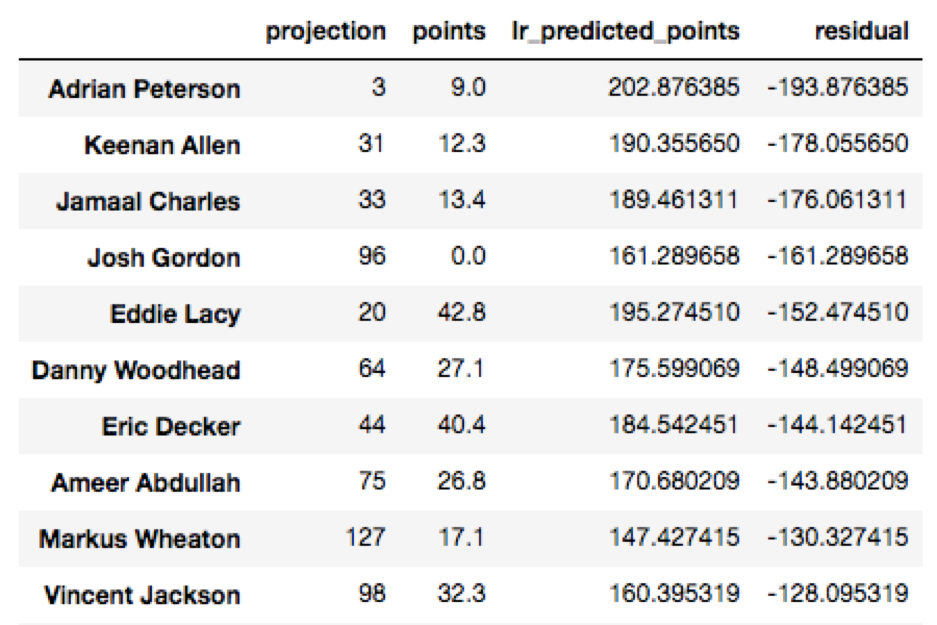
How much accuracy can you get by just using ESPN’s projected rankings to estimate how many fantasy points a player will score? Well, using RidgeCV with linear regression, normalization, and five fold cross-validation, we obtain a 26.6% adjusted R^2 on the training set and a 15.7% on the testing set. I will use the adjusted R^2 of 15.7% on my testing set as a benchmark as I add more features to the model.
What other features should we add? As you can see from the plot below, position seems to play a huge role. The quarterbacks plotted in blue tend to score more than the average player.
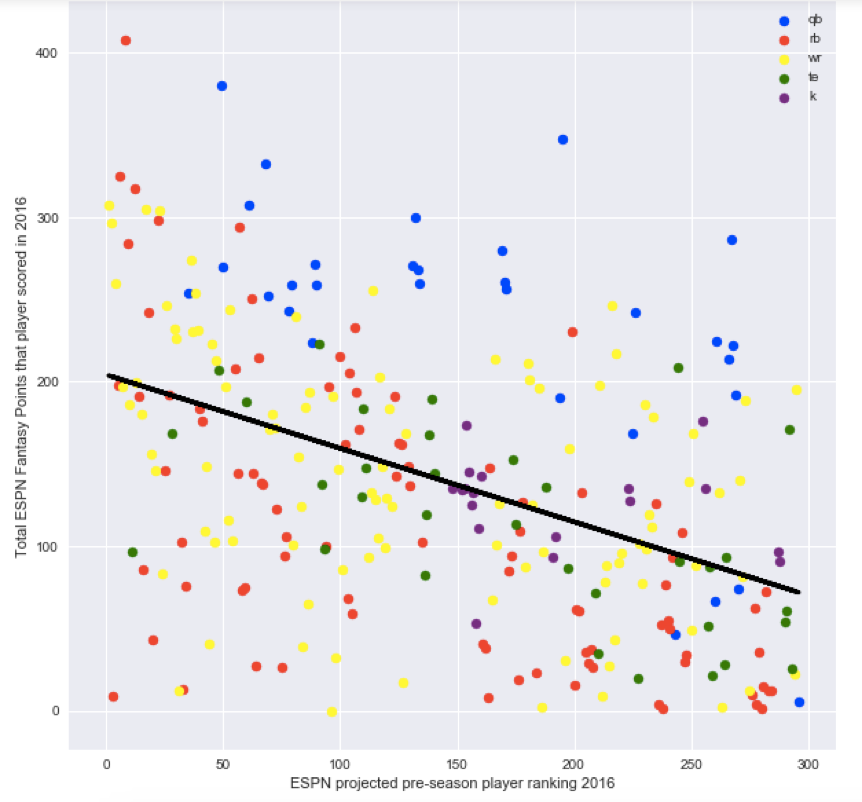
We can add position to our feature matrix by one hot encoding it so that a player being a quarterback will correspond to a “1” in the quarterback column and a 0 in the other columns for running back, wide receiver, etc. What effect did adding position to ESPN’s rankings have on being able to predict player points? It nearly doubled the adjusted R^2 on the testing set from 15.7% to 28.4%!
Woohoo! Adding our first additional feature worked. As we add more features, we’ll definitely get a higher adjusted R^2 on our test data, right? WRONG. As you’ll see below, I considered many other factors, and none of them raised the adjusted R^2 on our test data. This was most likely due to the small nature of my data set (there were only 277 players on ESPN’s projection list once I removed defenses). Here were some other features that I considered.
Age. You would probably guess that age versus points might be shaped like a downward parabola - rookies and older players would score less points, and there would be some peak age in between. Unfortunately, age versus points scored demonstrated no such pattern, as shown below, and thus didn’t improve our model.

Team. Upon first glance, it seemed like what team a player was on might have an effect, as the correlation coefficients for certain teams (such as New Orleans) suggested a favorable effect on points, and teams such as poor San Francisco suggested a negative effect:
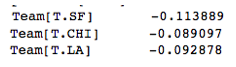
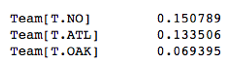
Unfortunately, adding team to the feature matrix did not increase my adjusted R^2 on my testing data.
College. I postulated that perhaps what college a player attended might affect his points. I wasn’t quite sure how to classify colleges so I did it two different ways: in my first analysis, I looked at which college teams historically had won the most championships since 1936. However, I figured that how many championships a college won in the 1970s or 1980s might not really have an effect on how a player was doing today. So alternatively, I considered how many of the top 300 current players according to EPSN were from each college. Top schools measured in each way are located here:
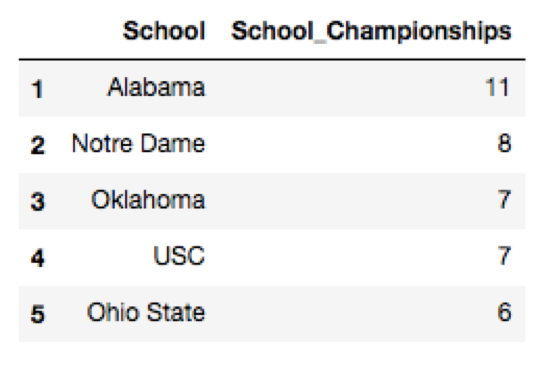
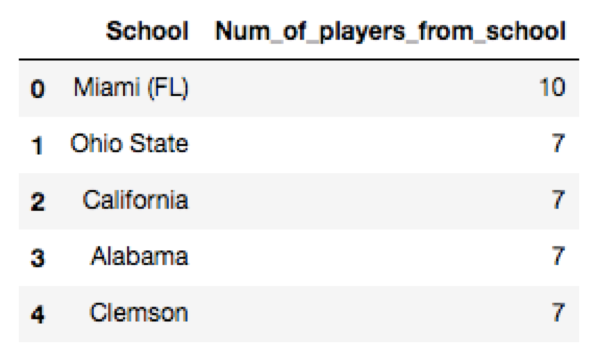
Unfortunately, neither measure of college increased our adjusted R^2 on the testing data.
Depth Chart. This information was a bit harder to come by, as I needed archived depth charts from the previous year. But luckily, someone from the internet had previously compiled this info and posted it on Reddit. Thank you, random internet dude! He carefully listed each team’s depth chart. For example, here were the Seahawks running backs:
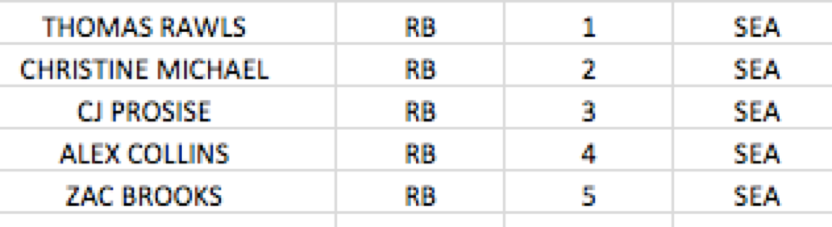
Unfortunately, this didn’t help our model either.
The previous year’s fantasy performance. I found the previous year’s fantasy points here. Unfortunately, ESPN doesn’t archive their data, so I needed to use a different website, but I figured that the point comparisons were similar. This data would obviously not include rookies for the next year, but I still thought it would improve my model significantly. Unfortunately, once again, it didn’t improve our adjusted test R^2.
In summary, by using ESPN’s rankings plus position, we improve upon ESPN’s point predictions by double. In order to improve the model further, I’d like to include injury information and perhaps utilize Twitter to measure how each player is trending.
For this project, I used BeautifulSoup and Pandas’ read_html function to scrape the web. I used scikit-learn to build a pipeline that performed normalization of features, polynomial regression, and cross validation. I also used the package Fuzzy Wuzzy to match names like “Robert Griffin” and “Robert Griffin III” in order to merge my datasets. You can find my GitHub repo for this project here.