
Detecting Predatory Financial Practices At For Profit Colleges
There has been much talk over how much debt students are saddled with as they graduate from college. The most aggregious cases involving for-profit colleges such as University of Phoenix, DeVry, ITT, and Everest College have been well-documented, including on John Oliver and in government reports. However, even programs as highly regarded as Harvard’s drama program and Johns Hopkin’s music program have received failing Debt-To-Earning ratings by the government, as chronicled by the New York Times.
In my data science immersion program, I was assigned the task of using the classifier algorithms that we had learned to predict a topic of interest to me. I chose to predict whether a college would receive a passing or failing score on the government’s student debt analysis. That way, as new college programs pop up each year, prospective students know which schools to be wary of and the government knows which schools to keep its eye on for regulatory issues.
My first step in performing the analysis was to obtain data on colleges. Luckily, there is a wealth of information to be pulled from the government College Scorecard API. I pulled all 6,740 schools listed as “in operation” from the US. This included everything from private non-profit schools such as Harvard to large public universities to community colleges to for-profit private schools such as University of Phoenix to small for-profit trade schools with fun names like “Bos-Man’s Barber College”. It contained a massive amount of features related to student population, curriculum, and financial aid.
My second step was using Python pandas to merge this data set with the one containing the government’s school debt-to-earning ratings. This data set was incomplete in the sense that not every school was listed. In addition, most schools only had a few majors listed. I classifed a school as having a failing debt-to-earnings score if at least one of their majors had a failing score. This was a pretty harsh classifier, as it meant that Harvard and Johns Hopkins failed. A snippet of the government’s data set looked like this:
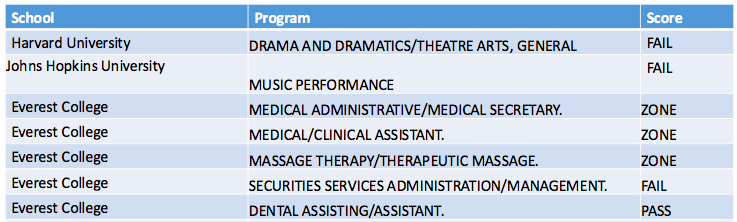
Despite the fact that Harvard and Hopkins made the failing list, only 9% of the programs on the DTE list had a failing status. While 66% of the schools on the list were for-profit, a whopping 97% of the schools listed as failing were for-profit.
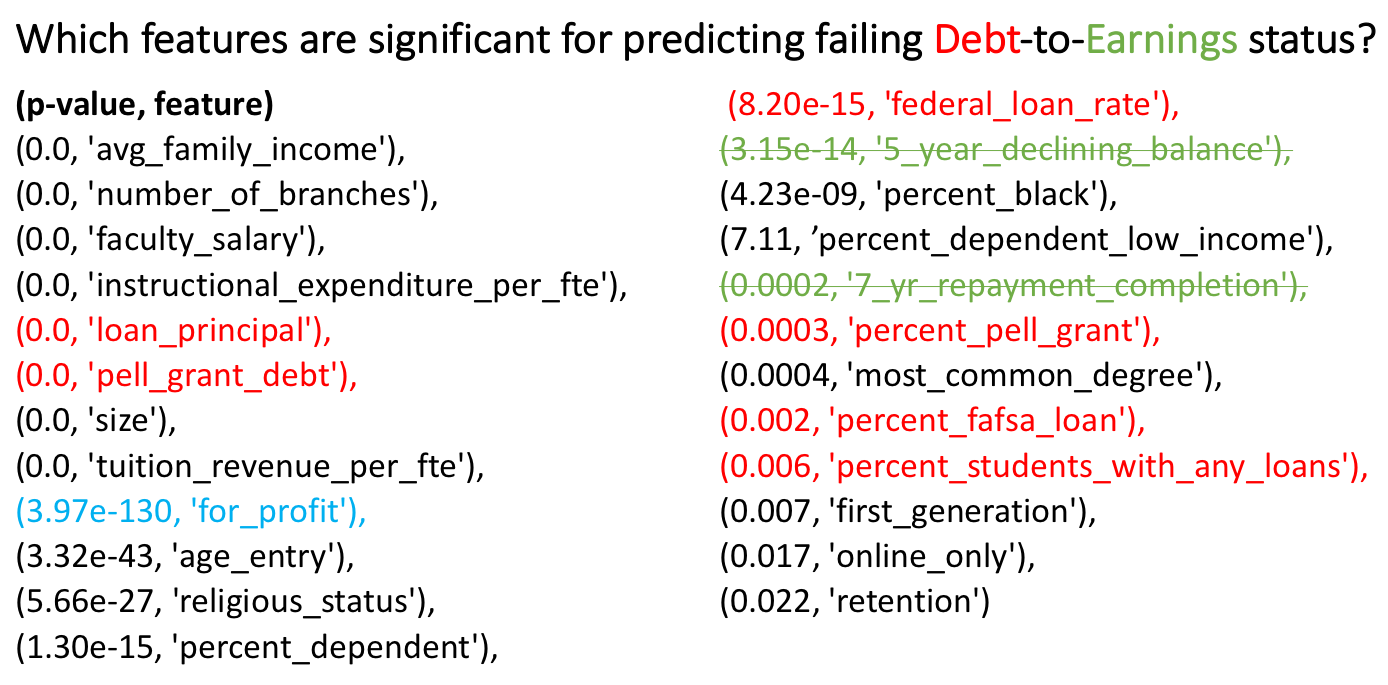
My third step was using the sklearn.feature_selection.SelectKBest method to select features that had a p-value of less than 0.05. Since I wanted to use these features to predict debt-to-earning scores, I highlighted the features related to debt in red and earnings in green. Notice that for-profit status also plays a major feature role. I have crossed the green features out because I will not know a student’s repayment status at the time of prediction. Thus, I will delete these variables from my features in order to eliminate information leak:
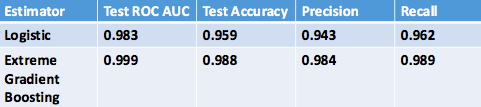
How well did these features do in predicting a failing DTE score? Fabulously! Here are the ROC AUCs for the various estimators I implemented:
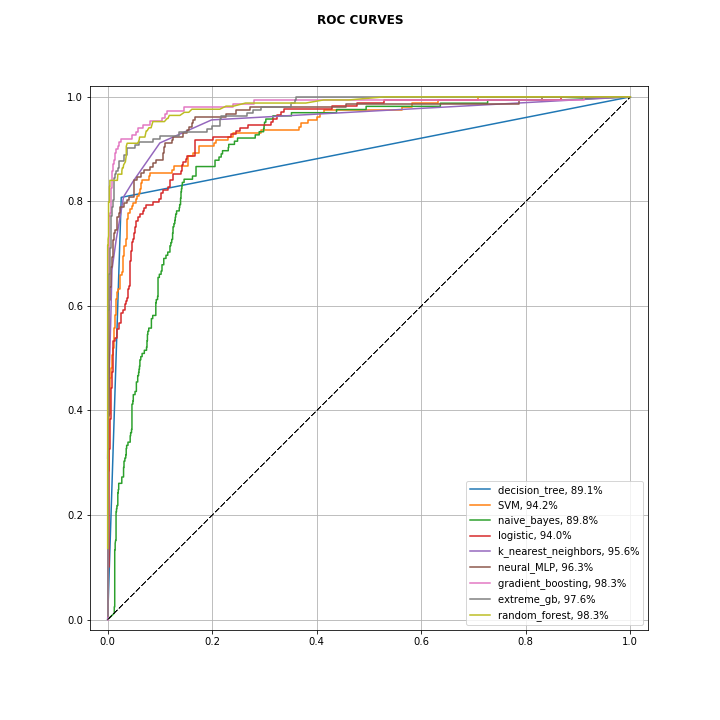
Using a five-fold test/train split, the XGBoost, for instance, had an average ROC AUC of 97.5, test accuracy of 96.8, precision of 92.3, and recall of 79.2. In plain english, of all the failing DTE schools, I find 79.2% of them. In addition, of all the schools I label as failing, I am correct 92.3% of the time. Not too shabby! While XGBoost performed a hair better than the MLP neural network classifier, it was fun to start playing around with neural networks, too.
Okay, now that we know that it’s easy to predict failing schools, let’s explore their commonalities. While 43% of the schools in our dataset were for-profit, an overwhelming 97% of the schools classifed with a failing DTE were for-profit. What makes for-profit schools so different? Well, it turns out many things.
First view the plot below of tuition revenue per fte versus instructional expenditure per fte. Loosely, you can think of this as a comparision of how much the school is profiting from you taking a class versus how much of that expense it is putting back into the classroom. We can see from the D3 graph below that for-profit schools (and especially the failing ones) are taking massive amounts of tuition from students and dedicating very little of it to the curriculum.
You can move your mouse over to view school names. The radius of the dots correspond to the number of branches. Large chains like DeVry and National American University in the bottom right were among the worst:
In addition, we can see from the plot below that while for-profit schools are taking in a lot of tuition from students, very little of that tuition is going towards faculty salaries. Faculty salaries at for-profits are considerably lower. You can see that the University of Phoenix has one of the worst faculty salaries:
Another very stark difference between for-profit and non-profit schools are the types of financing their students receive. Non-profit school students typically complete the Fafsa application, which initiates the process of receiving a federal loan. A federal student loan is borrowed money that must be paid back with interest. For-profit schools, however, have a much larger percentage of their students receiving Pell grants. A Pell grant, unlike a loan, does not need to be repaid. Loosely, the US taxpayers are giving this money directly to for-profit schools and will never be repaid. You can see the difference between for-profit and non-profit student financing here. Everest College, with a whopping 55 branches, is taking among the largest percentage of Pell grant money:
Lastly, there is also a stark difference in repayment rates of student loans between for and non-profit schools. For-profit schools have a much lower percentage of students with a declining loan balance 5 years after loan origination. In addition, they have a very low percentage of students who have repaid their loan in full seven years out:
How easily can for-profit schools and non-profit schools be distinguished? Well, if I use just four features that are extremely important to student education and faculty well-being (tuition revenue per fte, instructional expenditure per fte, 5 year declining loan balance, and faculty salary), then I can predict non-profit and for-profit status with 99% accuracy:
In summary, here are four take-aways from my project:
-
Using extreme gradient boosting, we have a model that detects 79% of schools receiving failing debt-to-earning scores.
-
Of the schools that our model predicts to be failing, we are correct 93% of the time.
-
The Department of Education may want to impose more regulation on for-profit schools, as they account for 97% of the failing schools.
-
For-profit and non-profit schools differ significantly in how much tuition revenue they collect from students, how much revenue they dedicate towards instruction, how much they pay their teachers, how much Pell grant money they take from taxpayers, and how quickly their alumni are able to pay back their loans.
I had a blast doing this project! I learned a ton about using scikit-learn classification algorithms and D3 visualization. I also used stored my data on an AWS server and accessed it using PostgreSQL. You can find my project code here.